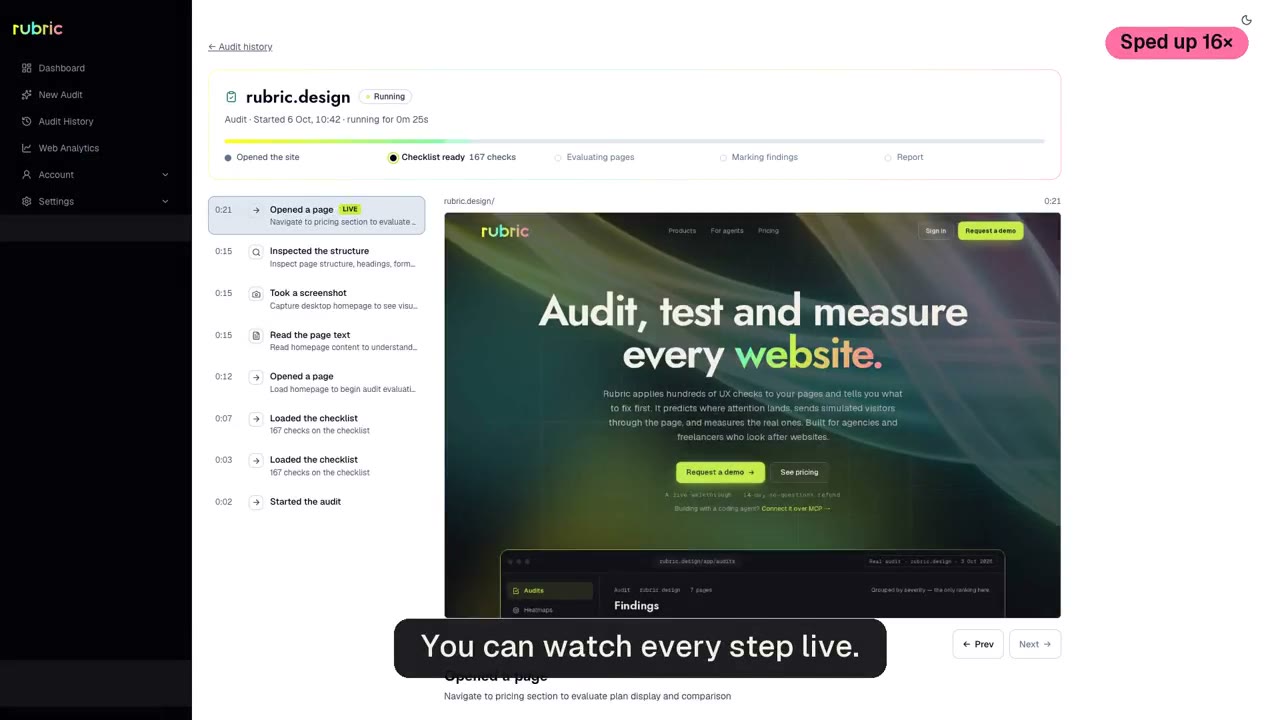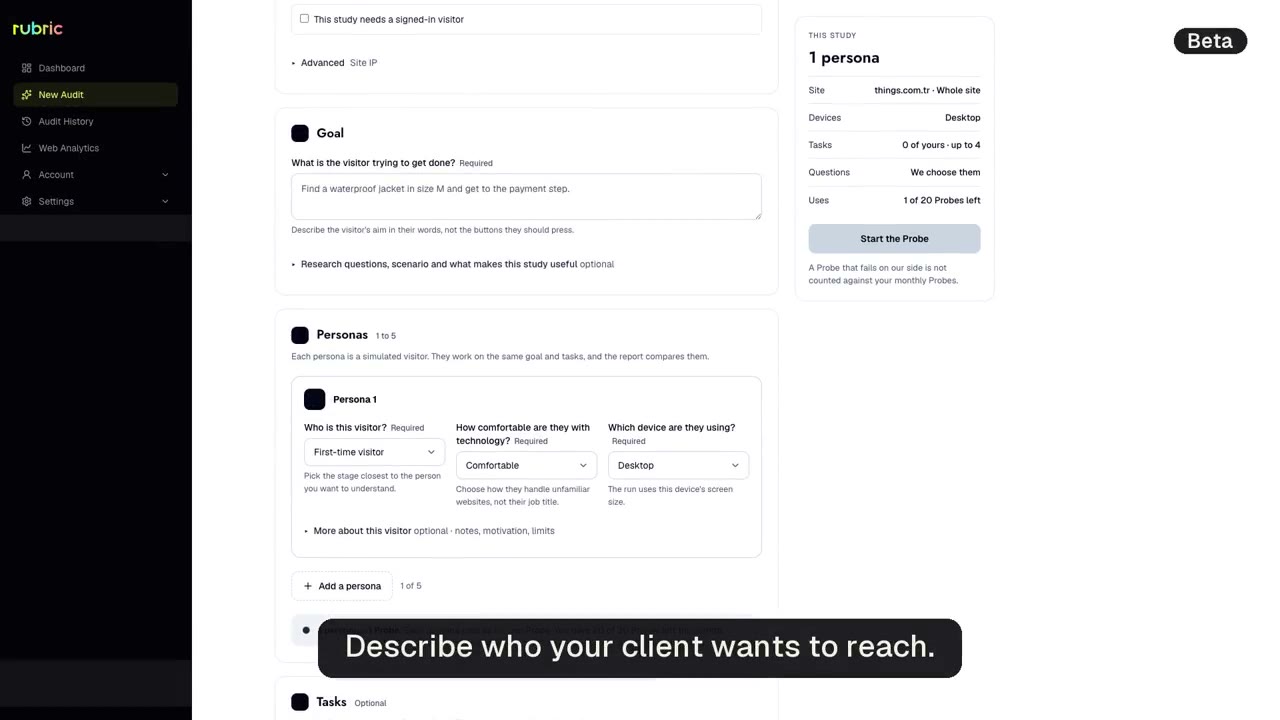
How it works
- 1
Add one line of script.
No cookies and no IP addresses stored.
- 2
Watch real visitors.
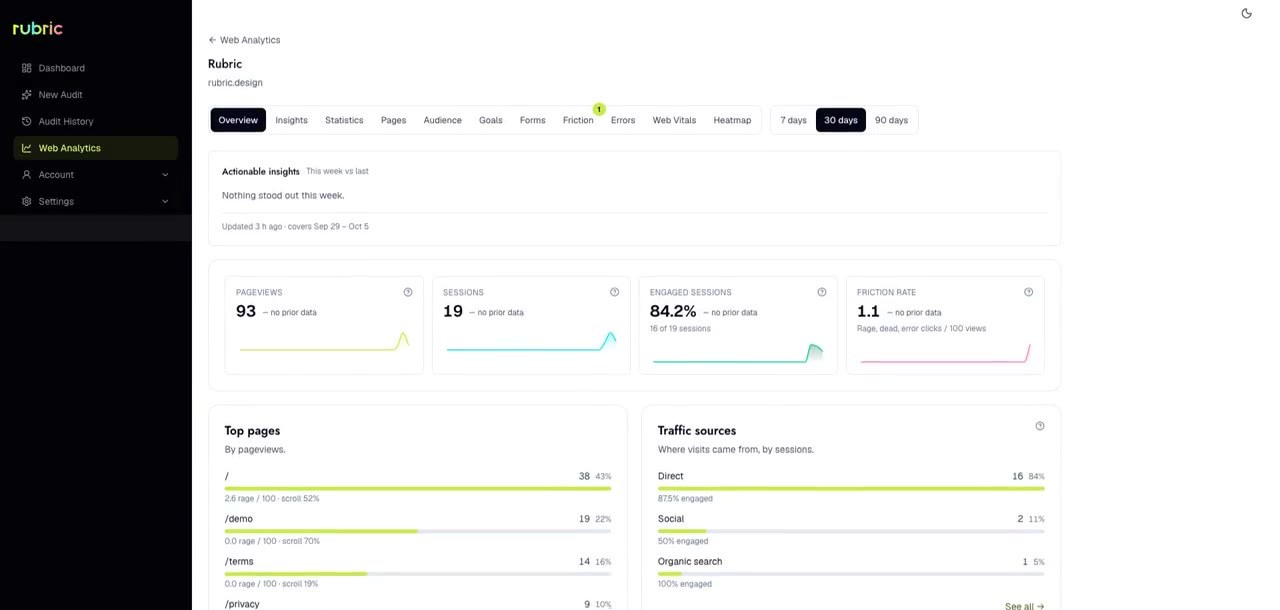
Pages, traffic sources, audience, goals, funnels, forms, errors and Web Vitals.
- 3
Read the weekly note.
The AI reads the week's numbers through the same UX knowledge the audits use and says what changed and what to do.
What you get
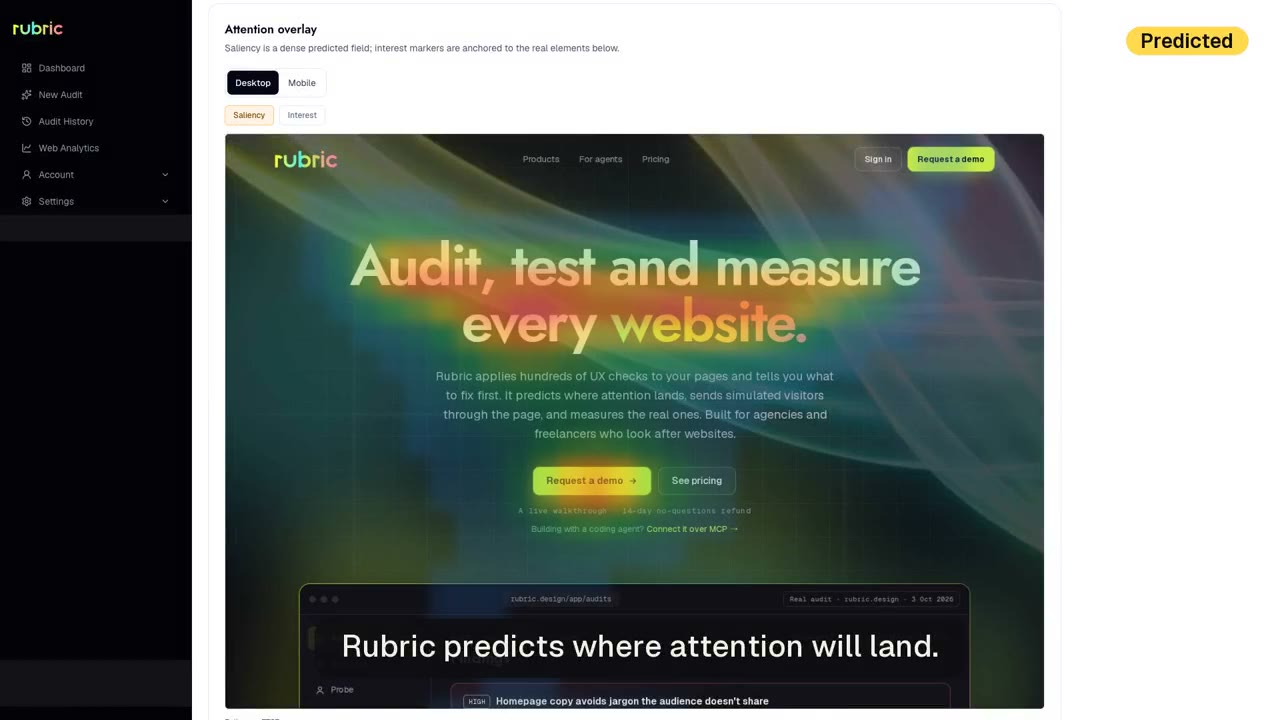
A dashboard per site, and the predicted heatmap one click away, so you can put the prediction next to the real numbers.
Good to know
Do I need a cookie banner for it?
Rubric Analytics sets no cookies. Check with your legal team for your own site.
When does the weekly note appear?
Once a site has at least 50 pageviews in a week.
In your planBasic 1 site and 5,000 pageviews a month, Pro 5 sites and 50,000.
See pricing →